Needless to say that from one software project to another, compile times vary greatly. When debugging we often spend a significant amount of time changing some lines of code, recompiling, waiting and then relaunching the software. While it is true that one has to change their debugging “style” from one project to another (i.e. having a thorough understanding of the problem before “poking around” code is definitely a plus when dealing with big code bases where edit-and-continue is not possible), waiting for the compiler and linker when debugging is never fun. It’s also very unproductive.
In parallel, some of the tools we use everyday allow us to greatly improve our debugging efficiency, though sometimes we are completely oblivious to the power that is available to us. Regardless of how fast or slow compile and link times are on your current project, any tools that can mitigate the recompile cycle when debugging are welcome. One such tool is Visual Studio’s tracepoint: a breakpoint with a custom action associated to it.
Many think tracepoints are only useful for outputting additional “on-the-fly” debugging information. Of course tracepoints can be used to add additional printf’s as you’re stepping inside code (or quickly spinning inside loops and various functions), but they also have this amazing ability to “execute code”. Case in point, I can’t actually recall when this amazing feature was added, but it’s been news to people I’ve talked to about it…
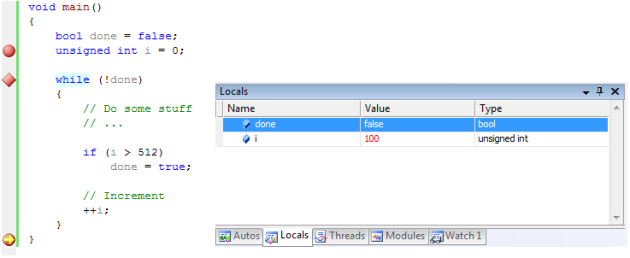
As we can see in the (very useful :)) code above, two breakpoints and a tracepoint are set. To convert a breakpoint to a tracepoint, right-click then select the “When hit…” option:
The following window will open:
Microsoft has put up several pages explaining how one can use tracepoints to format and output information (using the special keywords mentioned above, but others as well). While it is true that you can use tracepoints for fetching the content of variables (and outputting them in the Output window), it is not clearly mentioned that tracepoints also allows you to programmatically modify variables, in real-time.
If we go back to the previous code example, let’s say while debugging we realize that the while-loop should stop after 100 iterations (rather than 512). Instead of editing the code, and recompiling, we can simply setup a tracepoint that will update the done variable.
By setting { done = (i == 100); } along with Continue execution, the done variable gets updated every time the loop iterates, with the applied conditional. The loop will then stop when the condition is fulfilled.
You can also concatenate several instructions on the same line. They simply have to be separated by curly braces:
i.e. { {done = (i == 100);} { object.x -= 1.0f; } { data[15] = 3; } }
While this is a very simple example, this also works well with arrays of simple types, as well as structures. Although the scope of what you can do is limited — for instance, you can’t go wild and call functions — the ability to quickly update variables and behaviour on the fly definitely adds to the debugging process. See how this can be used with your codebase and try using this feature the next time you debug code. I can guarantee you will enjoy the ability to temporarily change calculations and behavior without having to recompile!
Many thanks to Stephen Hill (Ubisoft) for reviewing this post.


One thought on “A Taste of Live Code Editing With Visual Studio’s Tracepoints”